STRATEGY / 2023-2024
Creative Budget Calculator
À La Carte Pricing Tool for Multi-Channel Advertising Campaigns
How do you price creative work before you even make it? And how do you scale that pricing across dozens of ad formats, three business channels, and infinite personalization combinations? As Director of Creative Technology & Strategy at Inmar, I designed the Creative Budget Calculator that answered these questions, transforming campaign planning from negotiation to strategic process.
The Problem
Inmar's creative and planning teams were drowning in budget exception requests. We tried setting minimum fees based on the number of creative permutations needed for personalization, but this approach created more problems than it solved.
Campaign packages had evolved in silos across digital, retail, and social channels. Each channel had different pricing, different minimums, different rules. Sales kept requesting exceptions to align creative budgets with their total campaign spend. Account teams were caught in the middle. Creative directors couldn't plan resources.
We were treating creative like a fixed product when it needed to scale proportionally with media investment. Every campaign became a negotiation instead of a strategic planning exercise. Without a transparent framework, we couldn't scale creative solutions or clearly communicate their value to clients.
My Role
As Director of Creative Technology & Strategy, I owned this project from concept to org-wide adoption:
- Conceptualized the framework addressing expanding personalization needs across evolving product offerings. Identified the root problem: pricing complexity compounded by lack of transparency, making it impossible for teams to understand or predict costs.
- Designed and built the calculator from initial Google Sheets model through web application evolution. Worked directly with media planners and creative directors to ensure the model reflected actual workflows.
- Established an organization-wide standard for defining and quantifying creative value. Created the pricing methodology that became the source of truth.
- Led cross-functional adoption across creative, media planning, finance, and account teams. Drove change management to ensure consistent implementation.
Business Impact
The Creative Calculator delivered measurable impact across the organization:
Adoption
Org-Wide Standard
All media planning teams use the calculator
Authority
Source of Truth
Definitive tool for creative scoping and client proposals
Efficiency
75% Exception Reduction
Significantly decreased ad-hoc pricing requests
Accuracy
Zero Manual Errors
Eliminated calculation mistakes in campaign planning
Scalability
$10K - $1M+
Supports campaigns of all sizes with consistent methodology
Evolution
Sheets → Web App
Transitioned to dedicated platform while enhancing UX
The Innovation: À La Carte Pricing
The breakthrough came from separating two distinct cost drivers that had always been bundled together.
Base Unit Costs: The creative asset itself (static banner, rich media, video, social format). Pricing was tiered based on complexity, from simple resizing work to fully custom creative with overlays, CTAs, and interactive elements.
Personalization Input Fees: Additional costs for each variable element that creates versions. Geographic messaging, audience targeting, product features, offers, language localization, daypart scheduling, weather triggers, retailer callouts, and more. Input fees scaled based on implementation complexity.
This separation gave media planners unprecedented control over budget allocation. They could instantly see the cost impact of adding personalization variables, enabling strategic tradeoffs between producing more units with minimal customization versus fewer units with deeper personalization, depending on campaign goals and budget constraints.
The creative budget allocation methodology came from analysis of historical campaign data, channel mix, creative volume, and labor costs. The calculator automatically tracked budget against this data-driven percentage, with real-time indicators showing when plans were approaching limits and built-in tolerance thresholds to guide recommendations.
Three-Channel Architecture
The calculator structure follows three distinct advertising channels, each with its own budget allocation and unit types.
Digital Breakout: Display ads (static, animated, rich media), video (base and custom), digital out-of-home, and audio with companion banners. This covered programmatic and direct-buy display inventory.
Retail Breakout: Onsite and offsite retail media units for RMNs like Walmart Connect, Publix, and Wakefern.
Social Breakout: Format-specific units for Meta, Pinterest, TikTok, YouTube, and more, with proper aspect ratios and platform specifications. Included both static and video formats across all major social platforms.
Each channel maintained independent budget tracking while rolling up to total creative allocation. The allocation percentage was data-driven, derived from analyzing historical campaign performance, channel distribution, creative volume requirements, and labor costs.
Technical Evolution
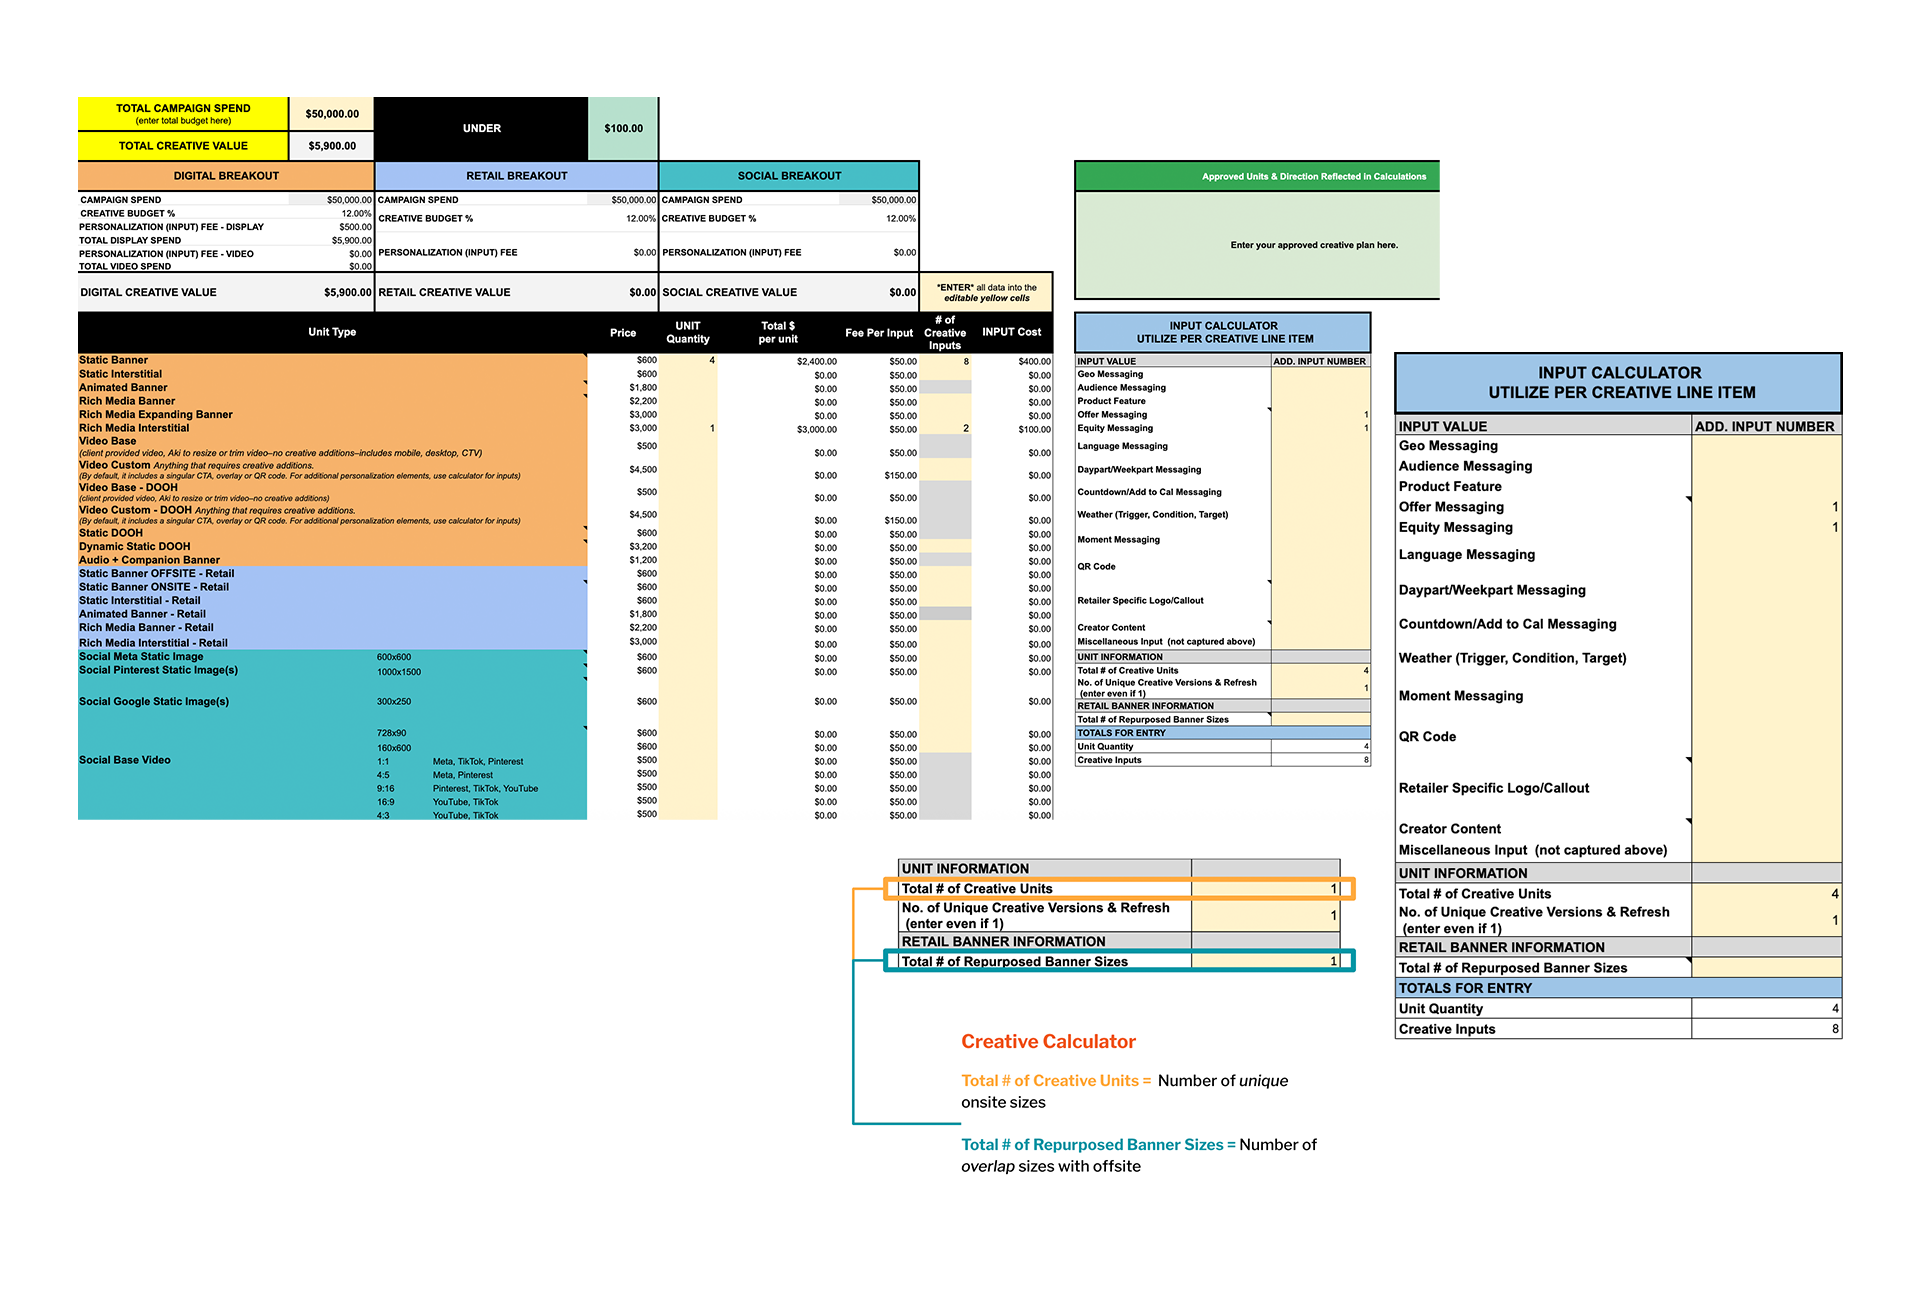
The calculator started as a sophisticated Google Sheets model with advanced formulas, conditional formatting, and data validation. The spreadsheet version shows the complete picture on one screen: budget status at top (green "UNDER" indicator), three color-coded channel breakouts (Digital/orange, Retail/blue, Social/teal), comprehensive unit pricing table, and the Input Calculator panel on the right.
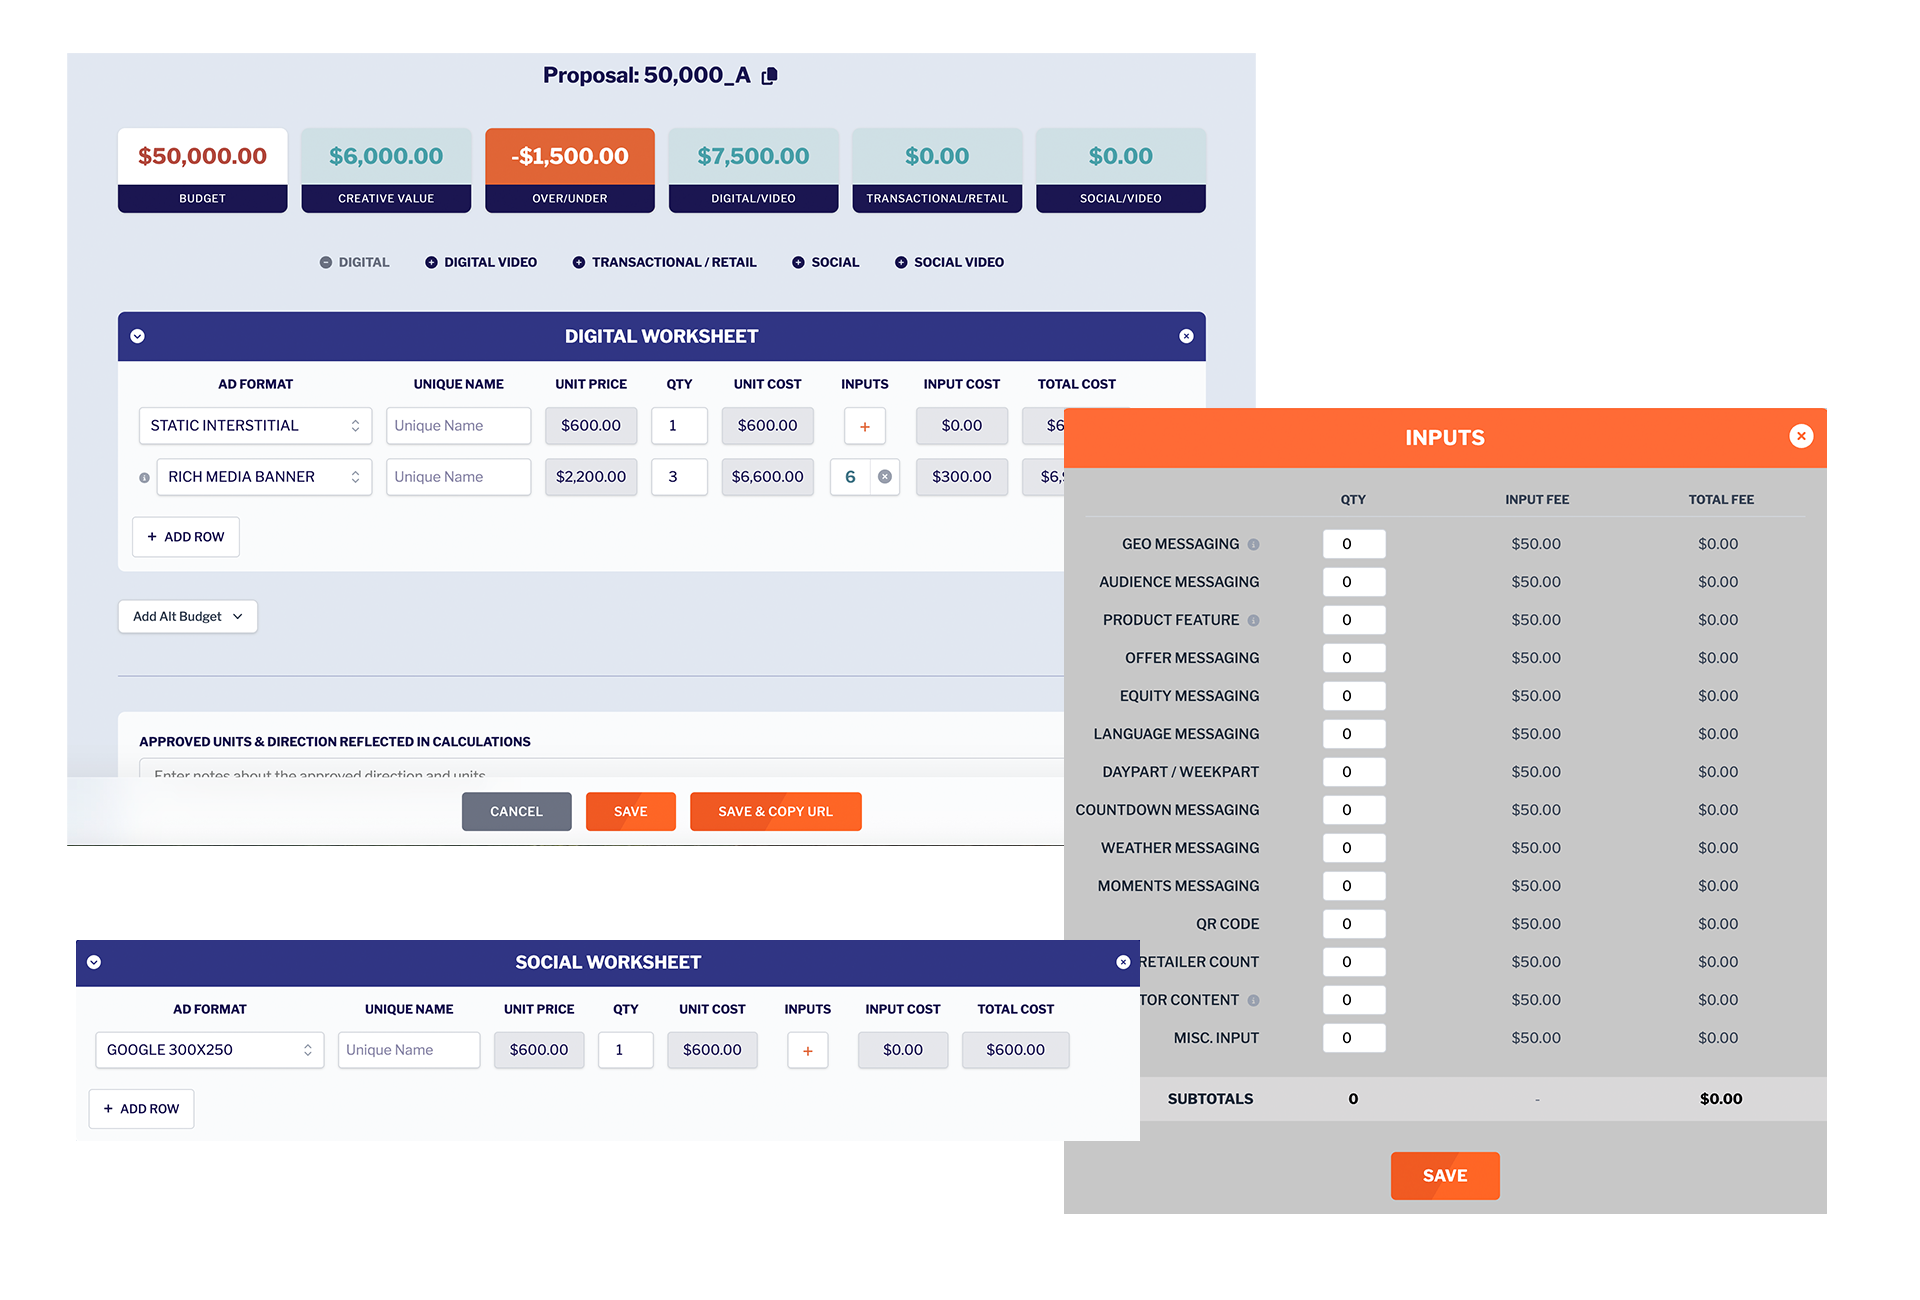
The web application brought significant UX improvements. The initial statement of work and requirements were defined, then outside development assistance was brought in to build the platform during the transition period.
Comprehensive Format Coverage
The calculator supports 30+ creative unit types across all major digital advertising channels:
- Display: Static banners, animated banners, rich media (expanding, interstitial)
- Video: Base video (resize/trim), custom video (with CTA, overlays, QR codes), DOOH video formats
- Digital Out of Home: Static DOOH, dynamic static DOOH
- Audio: Audio ads with companion banner units
- Retail Media: Onsite and offsite retail network formats, specialized retail interstitials
- Social Media: Platform-specific formats for Meta (1:1, 4:5), Pinterest (1000x1500, 2:3), TikTok (9:16), YouTube (16:9, 4:3)
- Video Aspect Ratios: 1:1, 4:5, 9:16, 16:9, 4:3, 2:3 covering all major platforms
Personalization Input Calculator
One of the most powerful features is the standardized input calculator. The system identifies 14 common personalization variables that drive creative versioning: Geo Messaging, Audience Messaging, Product Features, Offer Messaging, Equity Messaging, Language Localization, Daypart/Weekpart Scheduling, Countdown/Add to Calendar, Weather Triggers (condition, target, trigger), Moment Messaging, QR Codes, Retailer-Specific Logos/Callouts, Creator Content, and Miscellaneous Inputs.
Media planners select which inputs apply to their campaign, specify quantities, and the calculator automatically factors these into total creative costs. This transformed abstract "personalization fees" into transparent, itemized line items.
Skills Demonstrated
This project showcases my approach to strategic problem-solving:
- Strategic Thinking: Identified systemic organizational problem, designed solution addressing root cause rather than symptoms
- Financial Modeling: Built sophisticated pricing model with data-driven budget allocation methodology derived from historical campaign analysis
- Product Design: Created intuitive interface requiring light org-wide training, with real-time feedback and clear guidance
- Cross-Functional Leadership: Bridged creative, media, finance, and account teams to standardize processes org-wide
- Business Acumen: Applied deep understanding of media planning workflows and advertising channel dynamics
- Technical Execution: Built the initial spreadsheet solution and guided web application requirements before transition
- Change Management: Drove org-wide adoption of new methodology, becoming definitive source of truth